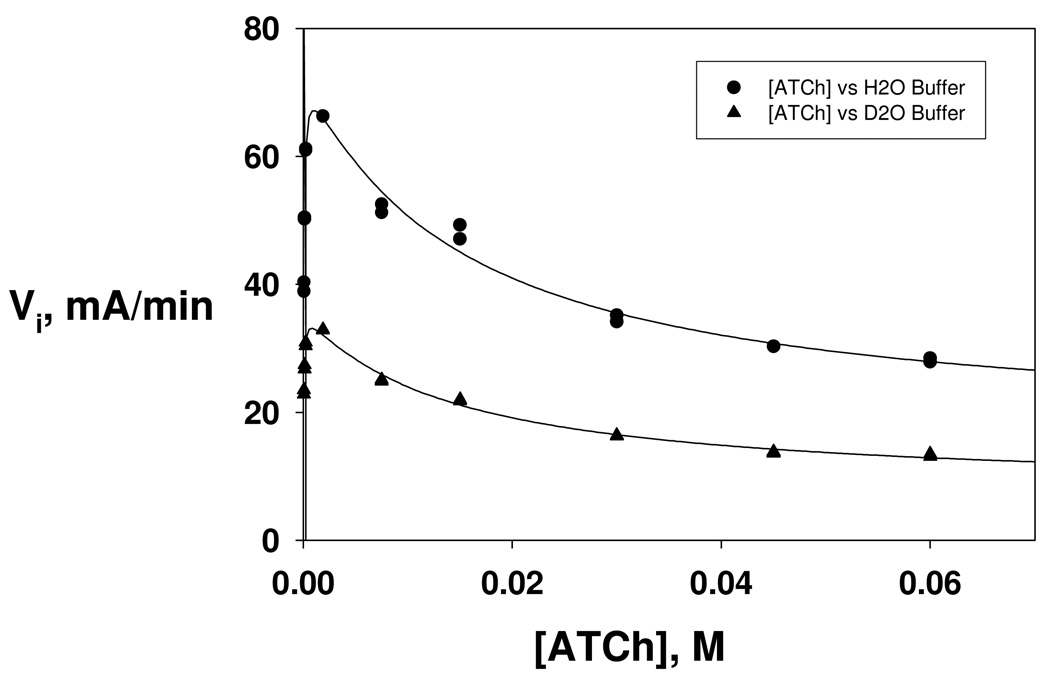
Figure 3.
Dependencies of initial velocities of DmAChE-catalyzed hydrolysis of ATCh on substrate concentration in equivalent buffers of H2O (circles) and D2O (triangles). Reaction conditions and data acquisition are described in the Experimental section. Each curve was fitted by least-squares to equation 1 of the text, and the following isotope effects were calculated from the least-squares parameters: D2OVmax = 2.06 ± 0.08, D2OKm = 1.5 ± 0.2, D2OKA = 1.1 ± 0.3, D2Oβ = 1.0 ± 0.2.

