
Figure 1.
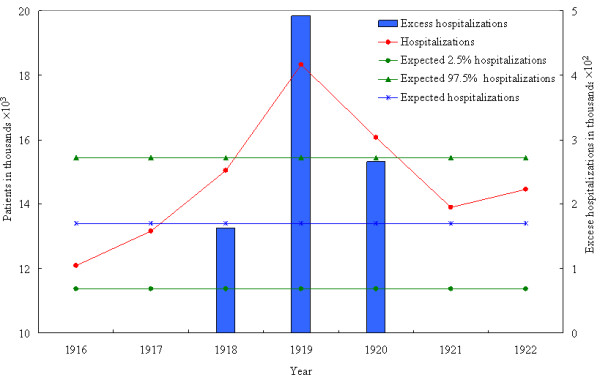
The yearly excess number of hospitalized patients reported by 12 public hospitals during 1918-1920 compared with the yearly averages during the adjacent "baseline" years of 1916, 1917, 1921, and 1922. Blue bars denoting the excess numbers are scaled to the right side of the figure.