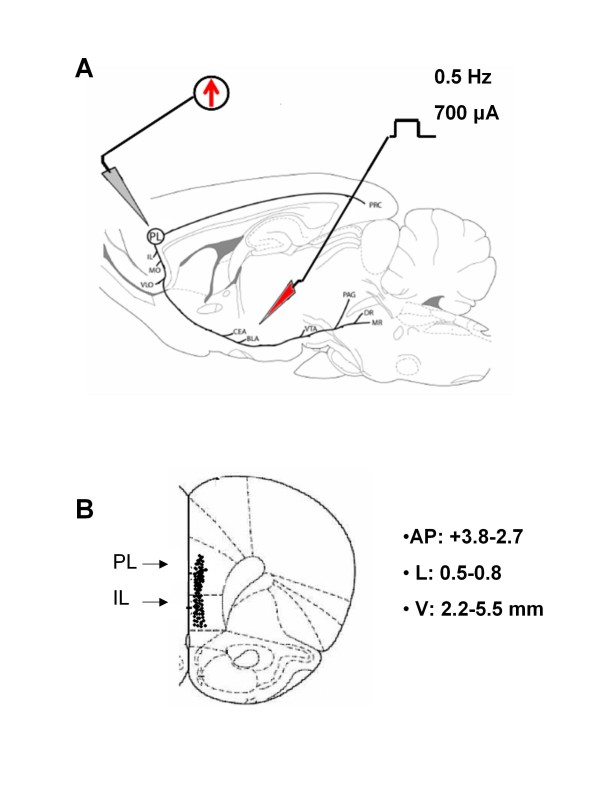
Figure 1.
Representative schematic illustration showing the location of the recording electrode in the PL/IL cortex and of the stimulation electrode in the BLA (A). Number values refer to stimulation parameters. Abbreviations: CEA, central nucleus of amygdala; BLA, basolateral nucleus of amygdala; VTA, ventral tegmental area; PAG, periaqueductal gray; DR, dorsal raphe nucleus; PL, prelimbic cortex; IL, infralimbic cortex; MO, medial orbital cortex; PRC, perirhinal cortex. Reprinted from Vertes [99]. Schematic illustration of the PL/IL cortex recording sites (B). Filled circles represent mPFC cell recorded sites. Number values indicate distance to bregma.

