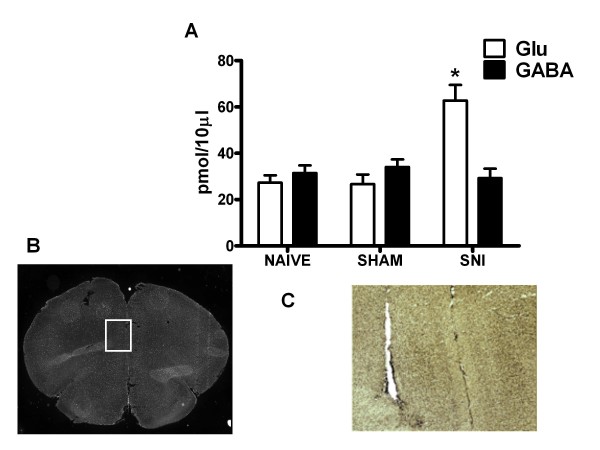
Figure 6.
"A" shows the release of glutamate and GABA in naïve, sham or SNI rats 7 days after injury. The values of extracellular GABA and glutamate in the mPFC were expressed as pmol in 10 μl of perfusate. * indicate significant difference vs sham rats. Each point represents the mean ± S.E.M of 7-8 animals per group. P values < 0.05 were considered statistically significant. "B" shows a panoramic picture of the pre-frontal cortex, the square indicates the pre/infra-limbic area. "C" shows a high magnification of the microdialysis probe location for aminoacid collection within the the pre/infra-limbic cortex. Coronal brain slices containing the sites of implantation of the microdialysis probes were obtained after the experiment and processed for histological analysis.

