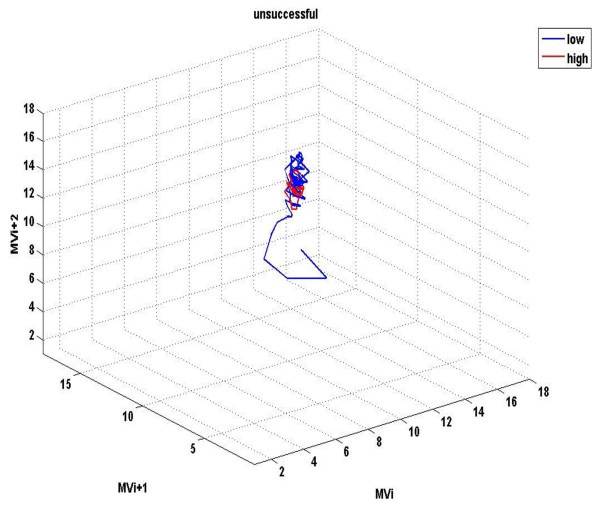
Figure 6.
Phase space of minute ventilation in a weaning failure patient. Red dots represent data during high PS ventilation, whereas blue dots represent data during the performance of a SBT. Scattering of data seem highly reduced, compared with findings in figure 5, whereas ventilation values are positioned in different parts of the space.

