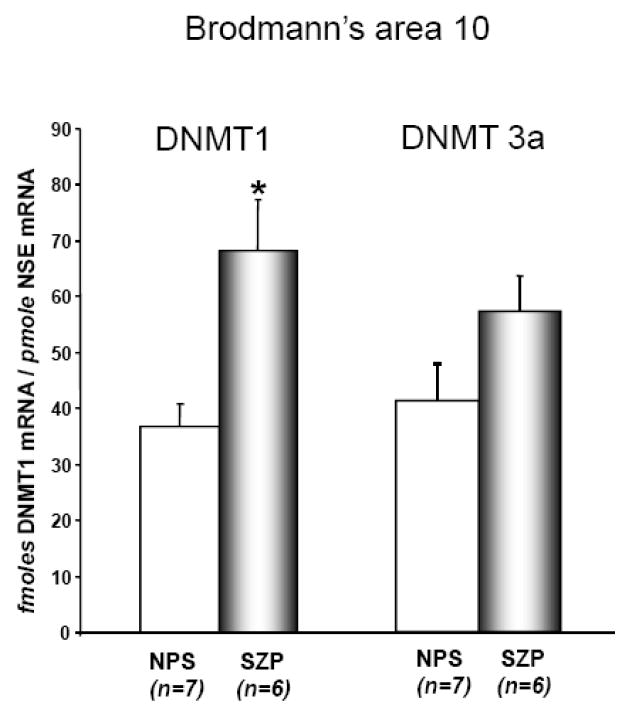
FIG 1. DNMT1 but not DNMT 3a mRNA is upregulated in BA 10 of SZP.
Both DNMT1 and DNMT3a mRNA measurements were carried out by competitive RT-PCR (see methods) in a group of fresh/frozen BA 10 samples obtained from the Harvard Brain Tissue Resource Center, McLean Hospital, Belmont, MA. (http://www.brainbank.mclean.org/) and with the following demographic characteristics: NPS (n=7), age 67±6.3, gender 4M/3F, PMI (postmortem interval) 24±1.3, brain pH=6.4±1.0, 3′ 5′-G3PDH ratio 1.7±0.2, 3′ 5′ β-actin ratio 2.9 ± 0.5, 28 s/18s RNA ratio 0.84±0.02, % probe sets present 46±1.7.
SZP (n=6), age 53±7.3, gender 4M/2F, PMI (postmortem interval) 22±1.7, brain pH=6.4±0.1, 3′ 5′ G3PDH ratio 1.4±0.1, 3′ 5′ β-actin ratio 2.4 ± 0.2, 28 s/18s RNA ratio 0.9±0.01, % probe sets present 48±0.7, duration of illness 22±3.2 years. All SZP were treated with neuroleptics.
DNMT1 mRNA levels were significantly higher in SZP compared to NPS (t=3.3, df=11, p=0.007). Also DNMT 3a was higher in SZP compared to NPS, but was a non-significant trend (t=1.8, df=11, p=0.11). The following background variables: age, gender, PMI, brain pH, G3PDH ratio, 3′ 5′ β-actin ratio, 28 s/18s RNA ratio and other factors were entered in analysis of covariance as confounds of DNMT1 and DNMT3a but failed to significantly alter the effect of diagnosis and so were not entered in the final model.
Each bar represents the mean ± SE.

