
FIG. 2. Density of DNMT3a mRNA positive neurons in different cortical layers of BA 10, caudate nucleus (CN), and putamen (PT) from NPS and SZP.
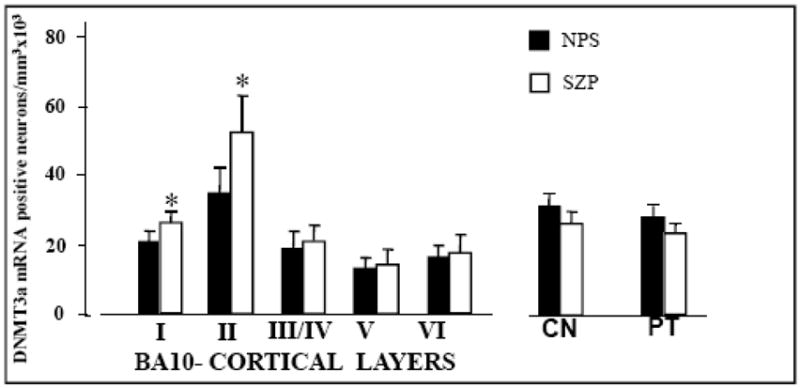
For the different cortical layers of BA10: each bar represents the mean ± SE of 8 NPS (filled bars) or 7 SZP (checkered bars) obtained from cohort A (see table 1). In the cortical layers the difference between SZP and NPS was calculated by repeated measure ANOVA followed by t-tests. Asterisks (*) indicate statistically significant differences in SZP compared to NPS: LI (P=0.05), LII (P=0.01), LIII/IV (P=NS), LV (P=NS), LVI (P=NS).
For the CN and PT: each bar represents the mean ± SE of 27 NPS and 20 SZP from cohort B (see table 1). There are not statistically significant differences between SZP and NPS. For further details on demographic characteristics of cohort B, see Veldic at al, 2007.
DNMT1 mRNA data in the same BA10 samples and in the CN and PT are reported in Fig 6 of Veldic et al., 2004 and on Fig 2 of Veldic et al., 2007, respectively.