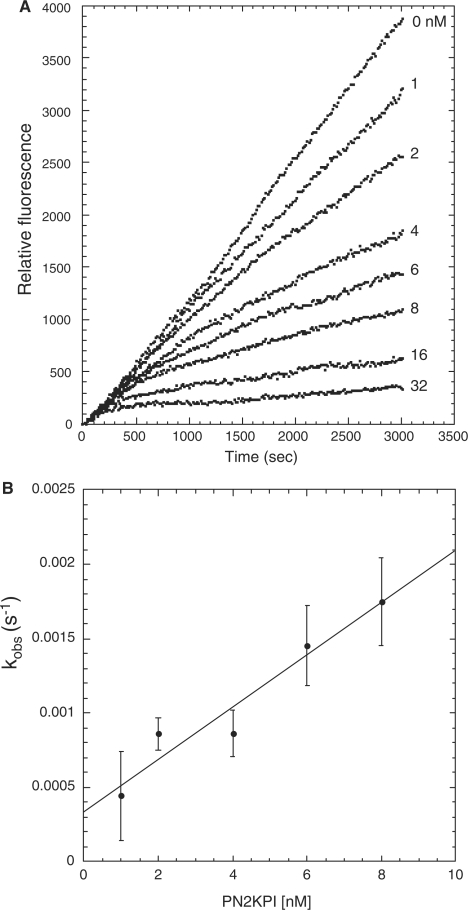
Fig. 3.
Progress curve of fluorogenic substrate (Boc-EAR-MCA) hydrolysis by FXIa in the presence of PN2KPI and the secondary plot. (A) Hydrolysis of Boc-EAR-MCA (275 µM) by FXIa (25 pM) in the presence of varying concentrations of PN2KPI (0–32 nM) were monitored for 3,000 s. Inhibitor concentrations used are shown on the right, adjacent to the respective curve. (B) Secondary plot of kobs values versus PN2KPI concentration. The values of kobs were obtained by fitting progress curve data shown in Figure (A) using equation (2). The kobs (s−1) values for each inhibitor concentration were calculated from the averaged values (± SEM) of three assays each done in duplicate. All assays were background subtracted with substrate autolysis for the entire assay duration.

