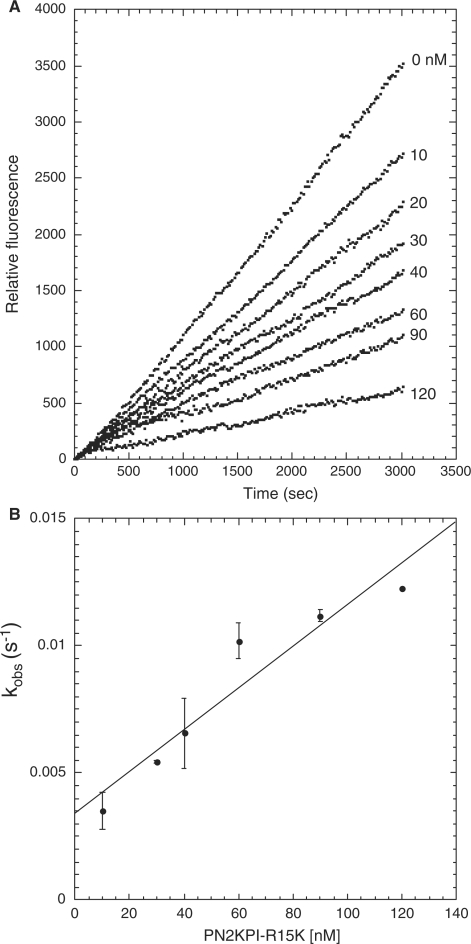
Fig. 4.
Progress curve of fluorogenic substrate (Boc-EAR-MCA) hydrolysis by FXIa in the presence of PN2KPI-R15 K and the secondary plot. (A) Hydrolysis of Boc-EAR-MCA (275 µM) by FXIa (25 pM) in the presence of varying concentrations of PN2KPI-R15 K (0–120 nM) were monitored for 3,000 s. Inhibitor concentrations used are shown on the right, adjacent to the respective curve. (B) Secondary plot of kobs values versus PN2KPI-R15 K concentration. The kobs (s−1) values for each inhibitor concentration were calculated from the averaged values (± SD) of three assays each done in duplicate. All assays were background subtracted with substrate autolysis for the entire assay duration.

