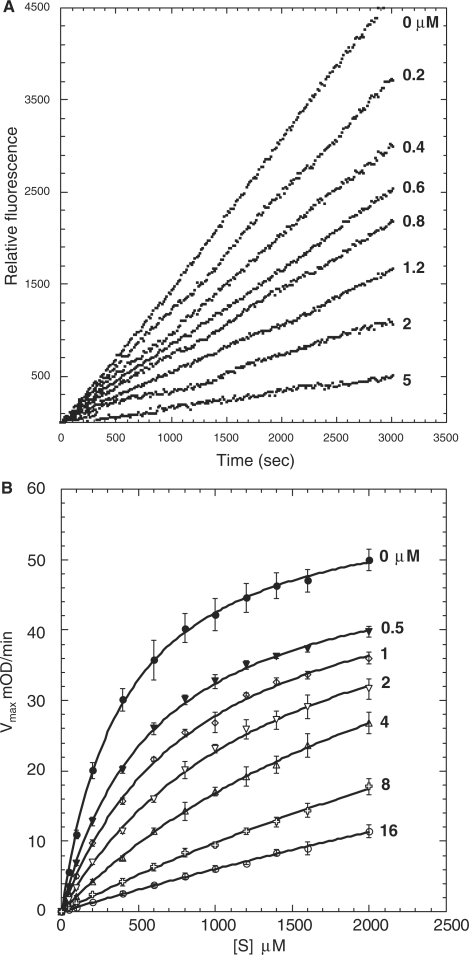
Fig. 5.
Progress curve of fluorogenic substrate (Boc-EAR-MCA) hydrolysis by FXIa in the presence of BPTI. (A) Hydrolysis of Boc-EAR-MCA (275 µM) by FXIa (25 pM) in the presence of varying concentrations of BPTI (0–5 µM) were monitored for 3,000 s. Inhibitor concentrations used are shown on the right, adjacent to the respective curve. (B) S-2366 hydrolysis by FXIa (1 nM) in the presence of varying concentrations of BPTI. Michaelis–Menten titration curves of initial rates as a function of substrate concentration were generated as described in the ‘Experimental procedures’ section. Each data point represents the mean (± SD) of two to four assays each done in duplicate.

