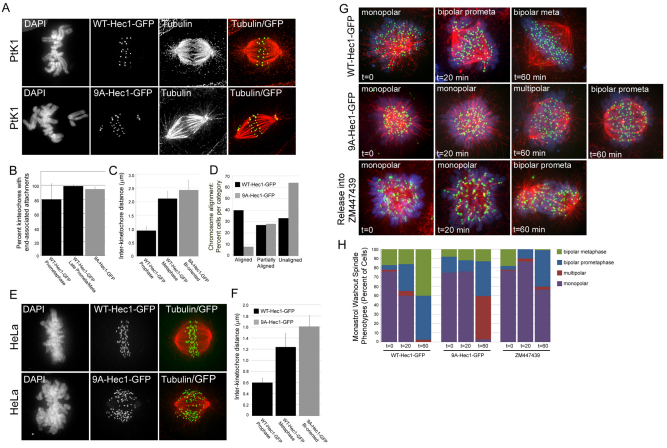
Fig. 1.
Hec1 N-terminal phosphorylation is required for normal chromosome congression and regulation of kinetochore–MT attachments. (A) Immunofluorescence images of PtK1 cells depleted of endogenous Hec1 and rescued with either WT-Hec1–GFP or 9A-Hec1–GFP. (B) Quantification of end- on microtubule association with kinetochores (WT-Hec1–GFP prometaphase: n=448 kinetochores, 19 cells; WT-Hec1–GFP late prometaphase and metaphase: n=428 kinetochores, 14 cells; 9A-Hec1–GFP: n=247 kinetochores, 10 cells). (C) Quantification of inter-kinetochore distances in PtK1 cells. Distances between sister pairs were measured from GFP-centroid to GFP-centroid. For WT-Hec1–GFP rescued cells, measurements were taken from prophase and metaphase cells (n=45 kinetochore pairs, 10 cells and n=128 kinetochore pairs, 22 cells, respectively). For cells rescued with 9A-Hec1–GFP, inter-kinetochore distances were measured only from sister pairs of bi-oriented chromosomes (n=141 kinetochore pairs, 19 cells). (D) Quantification of chromosome alignment (n=161 cells for WT-Hec1–GFP; n=107 for 9A-Hec1–GFP). Cells containing less than 2 chromosomes off a well-defined metaphase plate were scored as having ‘aligned’ chromosomes. Cells containing 2–3 chromosomes off a metaphase plate were scored as having ‘partially aligned’ chromosomes. Cells exhibiting no discernible metaphase plate or those containing greater than 3 chromosomes off a metaphase plate were scored as having ‘unaligned’ chromosomes. (E) Immunofluorescence images of HeLa cells depleted of endogenous Hec1 and rescued with either WT-Hec1–GFP or 9A-Hec1–GFP. (F) Quantification of inter-kinetochore distances in HeLa cells. The n values are as follows: WT-Hec1–GFP metaphase, n=76 kinetochore pairs, 6 cells; WT-Hec1–GFP prophase, n=24 kinetochore pairs, 2 cells; 9A-Hec1–GFP (only kinetochores from bi-oriented chromosomes were scored), n=59 kinetochore pairs, 5 cells. (G) Immunofluorescence images of cells subjected to a monastrol washout assay. The top two rows show cells transfected with the GFP-fusion protein as indicated. Cells were treated with monastrol for 2 hours and then incubated in fresh culture media + MG132 for 1 hour. Samples of cells were subjected to immunofluorescence just prior to initiation of the monastrol washout, 20 minutes post-initiation of washout and 60 minutes post-initiation of washout. For the experiment in the bottom row, untransfected cells were treated with monastrol for 2 hours and then incubated in fresh media containing MG132 and 10 μM ZM447439. The predominant phenotypes at the indicated time-points are shown. Chromosomes are shown in blue, microtubules are shown in red and kinetochores are shown in green (GFP–Hec1 for the top two panels; ACA antibody staining in the bottom panel). (H) Quantification of monastrol washout experiment. For each condition, at least 75 cells were scored. Error bars indicate s.d.

