Fig. 2.
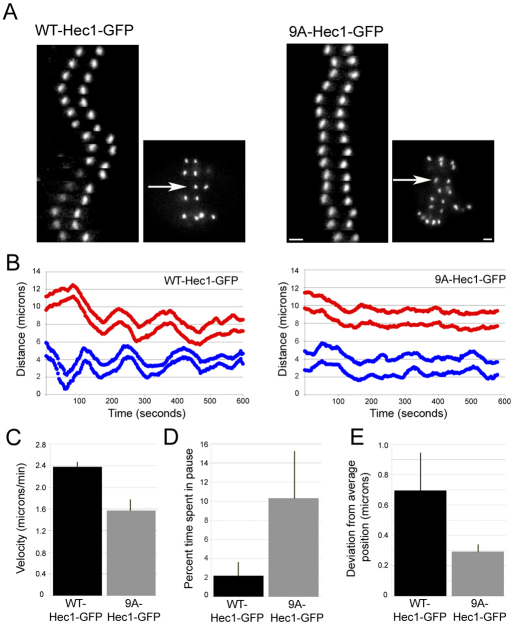
Hec1 N-terminal phosphorylation is required for normal kinetochore oscillations. (A) Kymographs of a single sister kinetochore pair from live-cell time-lapse imaging sequences of PtK1 cells depleted of endogenous Hec1 and rescued with WT-Hec1–GFP (left) or 9A-Hec1–GFP (right). The arrows indicate which pairs are represented in the kymographs. (B) Plots indicating kinetochore oscillation movement over time. For each rescue experiment, two representative sister kinetochore pairs are shown. (C) Quantification of average velocity of kinetochore movement in rescued cells. Both pole-ward and away from the pole movements were measured (for graphs in C, D and E: WT-Hec1–GFP rescue, n=9 kinetochores, 4 cells; 9A-Hec1–GFP rescue, n=13 kinetochores, 4 cells). (D) Quantification of percent time in pause. If a kinetochore did not move for two sequential time points (6 seconds), a pause event was recorded. The percentage of time spent ‘paused’ was then calculated from the total time of the time-lapse image sequence. (E) Deviation from average position (Stumpff et al., 2008) was quantified for kinetochores in cells rescued with WT-Hec1–GFP and 9A Hec1–GFP kinetochores (see Materials and Methods). Scale bars: 2 μm. Error bars indicate s.d.

