Figure 4.
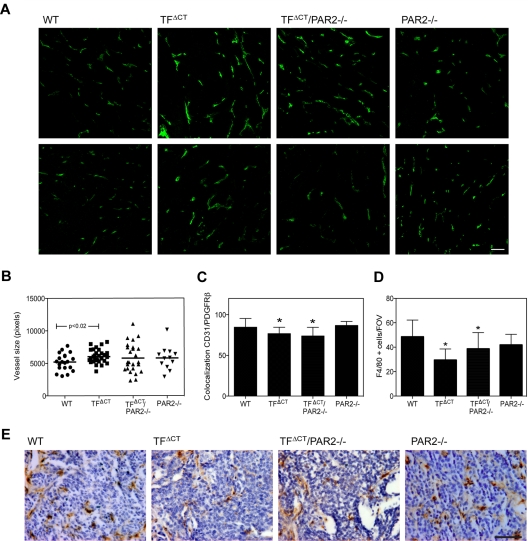
Altered tumor vessel appearance and macrophages recruitment in late stage tumors of TFΔCT mice. Tumors from 20-week-old PyMT WT, TFΔCT, TFΔCT/PAR2−/−, and PAR2−/− mice were stained for CD31 or F4/80. (A) Representative images of CD31 staining in late stage tumors, scale bar 50 μm. (B) CD31 area was quantified using Image Pro plus in 4 different areas of the tumors; n ≥ 5, mean ± SD, P = .02 PyMT WT versus TFΔCT, t test. (C) Tumor vessels coverage was assessed in PDGFRβ and CD31 costained sections, and colocalization of CD31 and PDFGR-β staining was quantified with Imaris in 4 different areas of at least 3 tumors per genotype (*P < .05 by ANOVA). (D) F4/80-positive cells were counted in 4 different tumor areas of at least 5 tumors per genotype, PyMT TFΔCT and TFΔCT/PAR2−/− different from WT, P < .001 ANOVA. (E) Representative images of F4/80-positive cells (brown staining) in PyMT WT, TFΔCT, TFΔCT/PAR2−/−, and PAR2−/− tumors; scale bar is 50 μm.

