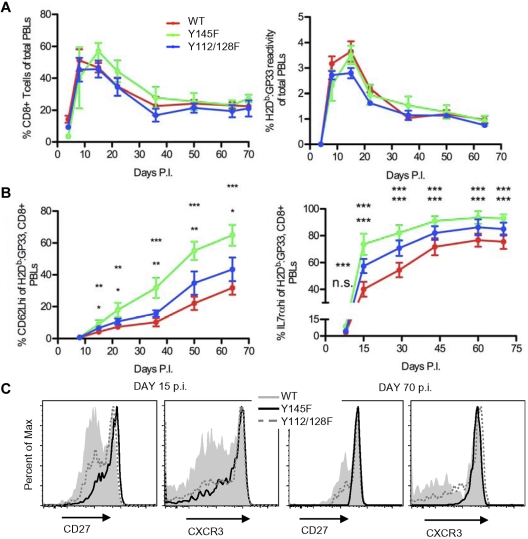
Figure 6.
SLP-76 KI mice generate long-lived memory T cells with accelerated acquisition of a “mature” phenotype. WT, Y145F, and Y112/128F mice were infected with LCMV Armstrong and monitored for 60-130 days. Data are representative of 3 independent experiments with 5-10 mice per group. (A) The percentage of CD8+ T cells (left panel) and H2Db:GP33-reactive CD8+ T cells (right panel) among PBLs from WT, Y145F, and Y112/128F mice at indicated days postinfection. (B) The percentage of CD62Lhi cells (left panel) and IL-7rαhi cells (right panel) among H2Db:GP33-reactive CD8+ PBLs from WT, Y145F, and Y112/128F mice at indicated days postinfection. Average percentage of cells ± SEM is shown. (C) CD27 and CXCR3 surface expression on WT, Y145F, and Y112/128F H2Db:GP33-reactive, CD8+ PBLs from day 15 (left panel) and day 70 (right panel) postinfection. Time points with significant differences between Y145F KI and WT (top asterisks) and Y112/128F KI and WT (bottom asterisks) are depicted: ***P < .001, **P = .001-.01, *P = .01-.05. Slopes of the graphic representation of CD62L expression over time were compared between WT and Y145F and WT and Y112/128F by nonlinear regression; P < .0001 for both comparisons. Slopes of the graphic representation of IL-7rα expression over time were compared between WT and Y145F and WT and Y112/128F by nonlinear regression and were not significantly different.

