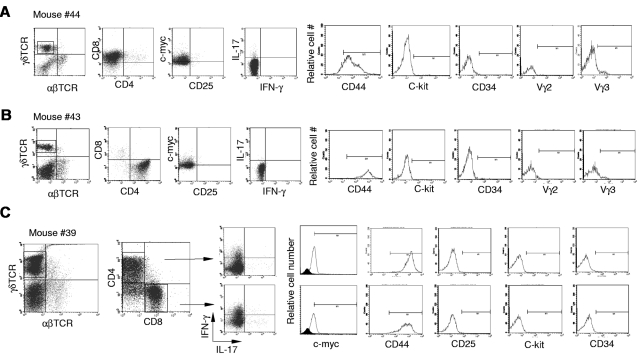
Figure 3.
Characterization of the γδ T-cell lymphomatous cells by flow cytometry. Lymphoma cells were isolated from the spleen in indicated representative mice and stained with indicated antibodies. For intracellular staining of the nuclear molecule c-myc, cells were first stained with antibodies to surface markers followed by intracellular staining with the nuclear buffer from eBioscience. For intracellular cytokine determination, cells were treated with phorbol 12-myristate 13-acetate plus ionomycine for 5 hours before staining. The tumor cells in the spleens are stained with antibodies against αβTCRs and γδTCRs (far left dot plots in no. 44, no. 43, and no. 39), and the following dot plots or histograms in each mouse are from gated γδ T-cell lymphoma cells. (A) Mouse no. 44 (same mouse as in Figure 1D-G), a representative CD4−CD8+ γδ T-cell lymphoma. (B) Mouse no. 43, a representative CD4+CD8− γδ T-cell lymphoma. (C) Mouse no. 39, a mixture of CD4+CD8− and CD4−CD8+ γδ T-cell lymphoma. The isotype control for c-Myc staining is included as filled histogram.

