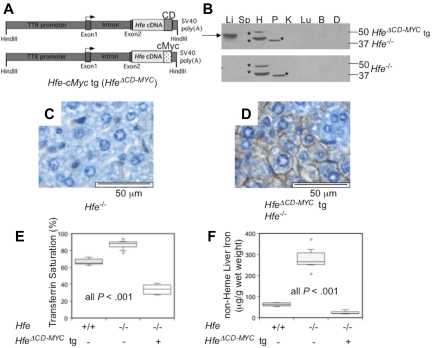
Figure 1.
Phenotypic analysis of mice expressing a truncated hepatocyte-specific Hfe-cMyc transgene (HfeΔCD−MYC tg). Schematic drawing of the HfeΔCD−MYC tg (A) substituting a c-Myc epitope (cMyc) for the Hfe cytoplasmic domain (CD). (B) Hfe-cMyc protein in the liver (Li), spleen (Sp), heart (H), pancreas (P), kidney (K), lung (Lu), brain (B), and duodenum (D) of 8 week-old Hfe−/− HfeΔCD−MYC tg animals (top panel) and Hfe−/− animals (bottom panel) analyzed by Western blot. Hfe-cMyc (arrow) and non-specific bands (*) are noted. Liver immunohistochemistry for cMyc epitope in Hfe−/− (C) and Hfe−/− HfeΔCD−MYC (D) animals (magnification 80X). Box plots depicting the (E) serum transferrin saturation (%), and (F) non-heme liver iron (μg/g wet weight). The bar within the box represents the median, while the top and bottom of the box are the 75th and 25th percentiles, respectively. The top and bottom whiskers depict the 90th and 10th percentiles, respectively. Data points outside of the 10th and 90th percentiles are drawn as circles. WT (n = 7), Hfe−/− (n = 12) and Hfe−/− HfeΔCD−MYC (n = 6) are depicted. P values were calculated with Microsoft Excel 2008 Version 12.2.6 (Student t test).

