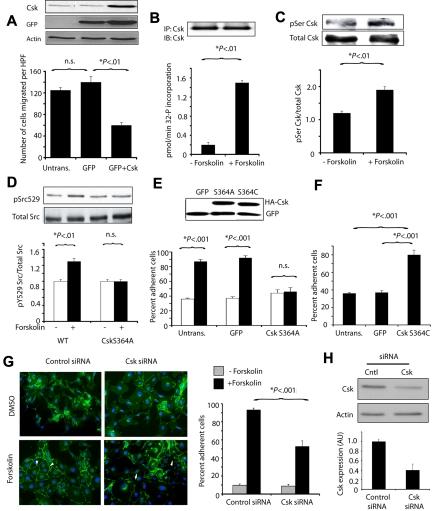
Figure 7.
PKA phosphorylates and activates Csk, which suppresses cell migration and promotes cell-cell adhesion. (A) Mean number of endothelial cells migrating on vitronectin ± SEM after transfection with WT Csk or GFP control vector. Blot: Csk, actin, and GFP expression detected by immunoblotting with anti-Csk (C-20), anti-GFP, and anti-actin antibodies. (B) Mean 32P incorporation into the Csk substrate polyGluTyr by immunoprecipitated Csk, expressed as pmol 32P incorporated per minute ± SEM without and with forskolin treatment. Blot: samples of Csk immunoprecipitates immunoblotted with anti-Csk antibodies. (C) Csk immunoprecipitated from cells treated with or without forskolin was immunoblotted with anti-phosphoserine and anti-Csk antibodies. Graph: ratio of serine phosphorylated Csk to total Csk. (D) Immunoblots of phosphoSrcY529 and total Src in lysates from cells expressing GFP or inactive Csk (CskS364A) treated with or without forskolin. Graph: ratio of phosphoSrcY529 to total Src. (E) Mean ± SEM percent adherent cells for endothelial cells transfected with GFP or CskS364A and treated with (black bars) or without (white bars) forskolin. Blot: Lysates of transfected cells from E and F immunoblotted to detect HA-tagged transgenes. (F) Mean ± SEM percent adherent cells for endothelial cells transfected with GFP or activated Csk (CskS364C). (G) Images and graph of mean ± SEM percent adherent cells for endothelial cells transfected with control or Csk siRNA and treated with or without forskolin. (H) Csk expression in cells treated with control or Csk siRNA demonstrated by immunoblotting. Graph: quantification of Csk expression.

