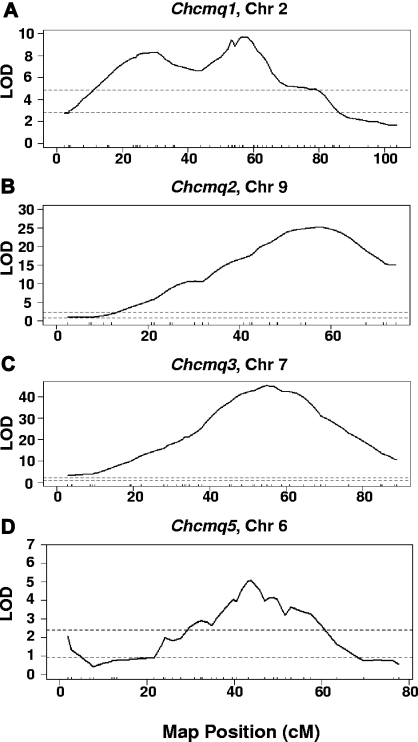
Figure 3.
Combined cross analysis. Ninety-five percent confidence intervals for (A) Chcmq1, (B) Chcmq2, (C) Chcmq3, and (D) Chcmq5 following combined cross analysis are shown. x-axis, map position in cM. y-axis, LOD score. Dashed lines denote significant (P = .05, top lines) and suggestive (P = .63, bottom lines) LOD scores as determined by permutation testing.

