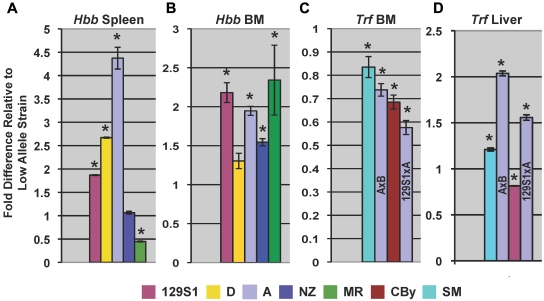
Figure 6.
qPCR. β-globin (Hbb) expression of high allele strains (color-coded) relative to the corresponding low allele strain in (A) spleen and (B) bone marrow (BM) in crosses detecting Chcmq3 (Table 2). qPCR primers (supplemental Table 1) exactly matched sequences in βS, βT, βdmajor, and βdminor. Bone marrow (C) and liver (D) Trf expression in crosses in which Chcmq2 was detected. Because strain A was the high allele in 2 different crosses, the specific cross is indicated directly on the bar graph. *Expression in high and low allele strains differ significantly (P ≤ .028).

