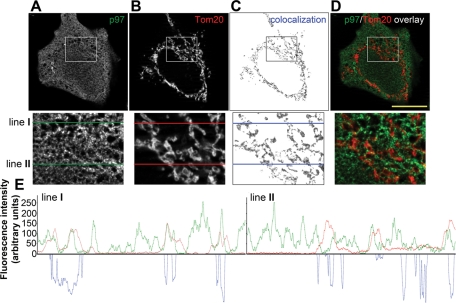
FIGURE 6:
Spatial relationship between p97 and the OMM. HeLa cells were immunostained to detect p97 (A and green fluorescence on overlay images shown in panel D) and Tom20, a marker of the OMM (B and red fluorescence on overlay images shown in panel D), followed by image acquisition and analysis using Zeiss AxioVision Colocalization software (Zeiss MicroImaging). The colocalizing pixels, representing the subcellular areas within a representative z-section containing both p97 and Tom20, are shown in panel C. The bottom images in panels A–D show magnified areas (bounded by squares). In panel E, line scans along the lines marked with I and II in the magnified areas taken from panels A–C are plotted (red lines represent Tom20 fluorescence pattern, green lines represent p97 fluorescence patterns, and blue represents colocalization of the green and red channels in pixels along lines I and II). Bar in D: 20 μm.

