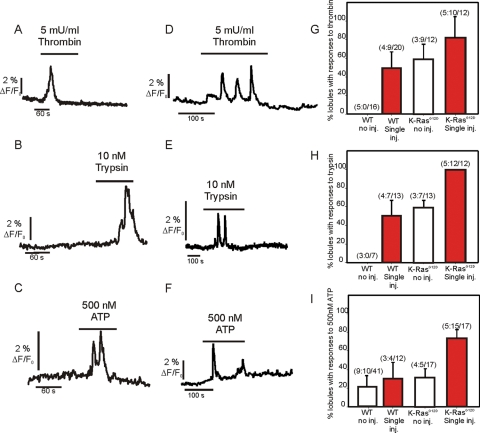
FIGURE 12:
Ca2+ in lobules following cerulein injection. (A–C) Representative Ca2+ signals evoked by the indicated agonists in periacinar cells from WT animals treated with cerulein for 1 wk as detailed in Materials and Methods. (D–F) Representative traces from LSL-K-RasG12D animals evoked by the indicated agonists following treatment with cerulein for 1 wk. (G–I) Pooled data representing the change in responsiveness of lobules to thrombin, trypsin, and ATP following treatment with cerulein. The numbers indicate the number of animals:number of lobules for which responses were observed/total number of lobules imaged.

