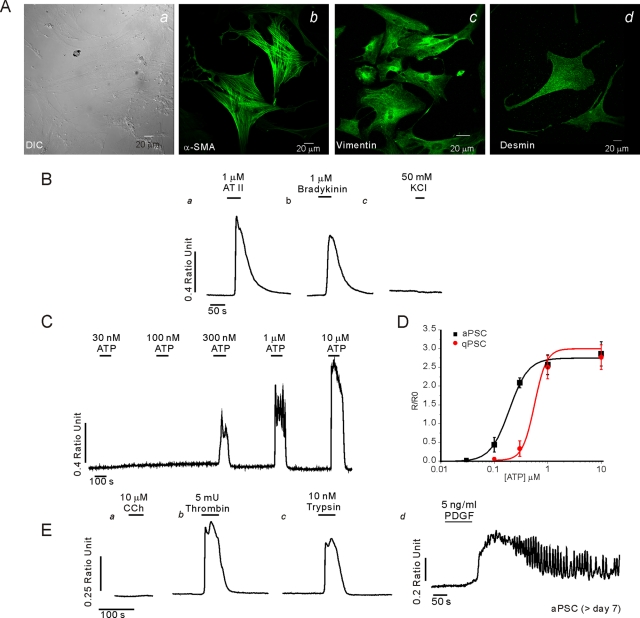
FIGURE 2:
Characterization of aPSC in culture. A morphological characterization is shown in (A). (Aa) Typical DIC images of aPSC at day 7 in culture. Prominent staining with α-SMA (Ab), vimentin (Ac), and desmin (Ad). (B–E) Representative Ca2+ imaging data from aPSC at day 7 in culture. Increases in [Ca2+]i were evoked by angiotensin (Ba) and bradykinin (Bb) but not KCl (Bc). (C) Cells responded to ATP. (D) Comparison of the concentration vs. response relationship for the ATP-evoked change in peak height in aPSC vs. qPSC. In contrast to qPSC, aPSC did not increase Ca2+ when challenged with CCh (Ea), but thrombin (Eb), trypsin (Ec), and PDGF (Ed) evoked robust elevations in [Ca2+]i.

