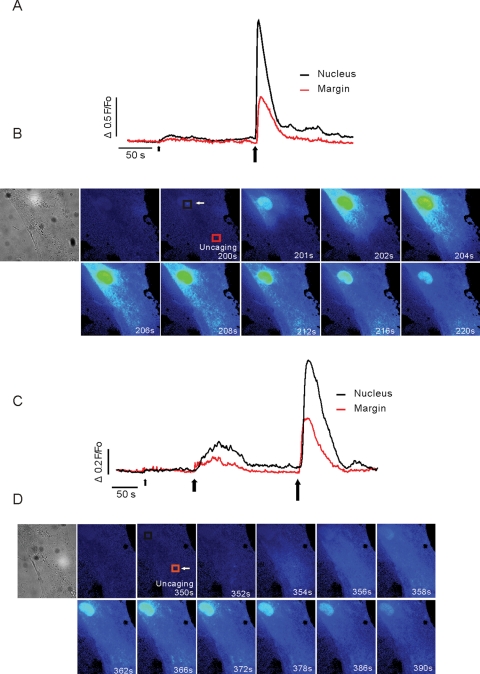
FIGURE 7:
Spatial characteristics of Ca2+ signals in aPSC following focal uncaging of ci-InsP3. (A and B) Response to focal production of ci-InsP3 in a ∼1.5-μm3 region located close to the nucleus. The kinetic trace showing a region of interest located ∼20 μm from the uncaging site (red trace) or in the nucleus (black trace). The arrowheads indicate the time/duration of uncaging (small arrow, 25 ms; larger arrow, 50 ms exposure to laser light). The images in (B) correspond to the indicated times following the second uncaging. Prominent, sustained changes in fluorescence are observed in the nucleus. (C and D) ci-InsP3 is produced some 20 μm from the nucleus (small arrow, 25 ms; large arrow, 50 ms; largest arrow, 75 ms). Kinetic and corresponding images following the final uncaging are shown in (C) and (D), respectively. A robust change in fluorescence is evoked and maintained in the nucleus.

