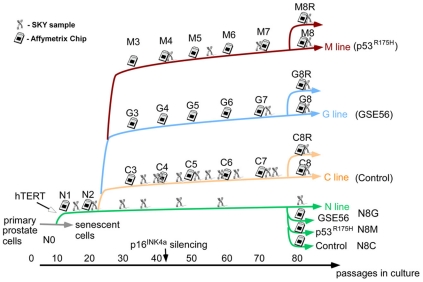
Figure 1. Establishment of the system consisting of four long term cultures.
Schematic representation of the main derivative cultures of the EP156T prostate epithelial cells. Each line stands for the subculture generated in vitro by introduction of specific genetic modifications. The x axis represents the number of passages in culture (about one week per passage). The chip symbols represent points at which cells were collected and their RNA hybridized to microarrays; the code for the resulting sample, e.g. G5, represents the line (G) and the approximate number (50) of passages in culture divided by ten. The chromosome symbol indicates a SKY measurement.

