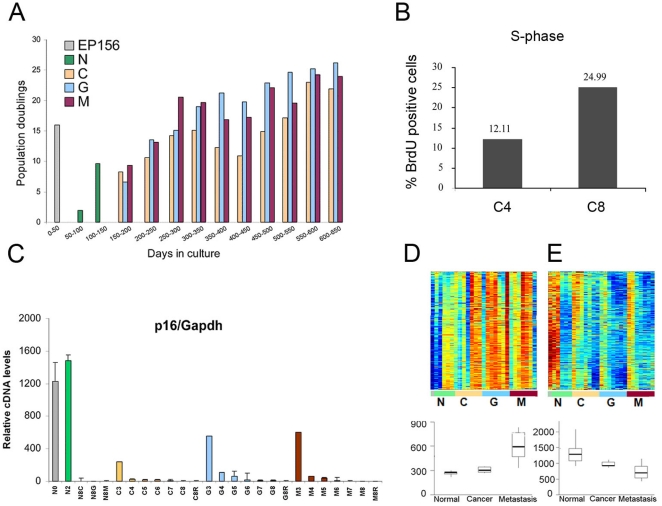
Figure 2. Late passages of EP156T sub cultures exhibit an increased growth pothential and a gene expression pattern resembeling that of prostate tumors.
A. Number of population doublings of EP156T-derived cultures (C, G and M) calculated in 50-day intervals during the 650-day culture period after hTERT infection, alongside with the number of population doublings performed by non-infected EP156 cells in the first 50 days in culture and the EP156T (N) cells during the next 100 days in culture. B. Percentage of proliferating cells (S-phase) was measured by BrdU labeling of early passage (C4) and late passage (C8) cells. C. Real time QRT-PCR for p16INK4a expression in the different samples of EP156T system. D. Top: Expression matrix of a cluster of genes whose expression increased during the transformation process. Within each line samples are ordered from early to late passages. Lower panel: the mean expression pattern of these genes in samples from prostate cancer patients [45]. The p-value for the difference in expression between normal and cancer is p = 0.00024 and from normal and cancer to metastasis is p = 0.00013. E. Top: Cluster of genes containing over-represented glycoprotein and extracellular region genes, the samples for each line are ordered from early to late passages. The cluster is down-regulated during the transformation process. The lower graph presents the mean expression of the cluster's genes in cancer samples [45]. The p-value for the difference in expression between normal and cancer is p = 0.00013 and from normal and cancer to metastasis is p = 0.00023.

