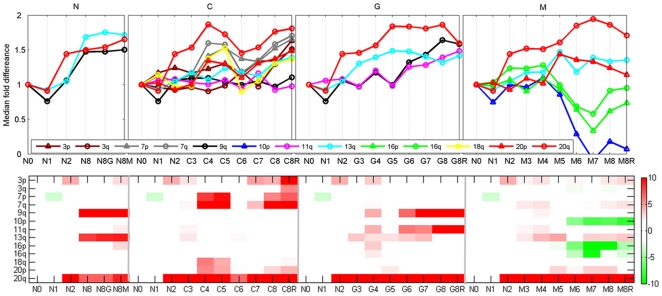
Figure 3. Copy number change from expression: results of the (Chromosomal Imbalance Analysis) algorithm.
Expression level of each gene annotated to a particular chromosomal arm was compared to its expression level in the N0 sample (EP156 primary cells at passage 8) that represents the parental culture of all four lines. For each of the N, C, G and M lines (see text) the upper panel shows the coordinated changes in the median of the expression of genes annotated to specific chromosomal regions, divided by their median expression in N0. The lower panel is the –log 10(p-value) of the paired t-test between the genes in N0 and the other samples (x-axis) on a specific chromosomal arm. The figure presents the statistically significant chromosomal arms (p-value<0.001 and median fold change >1.5 or <0.5 at least at one point).

