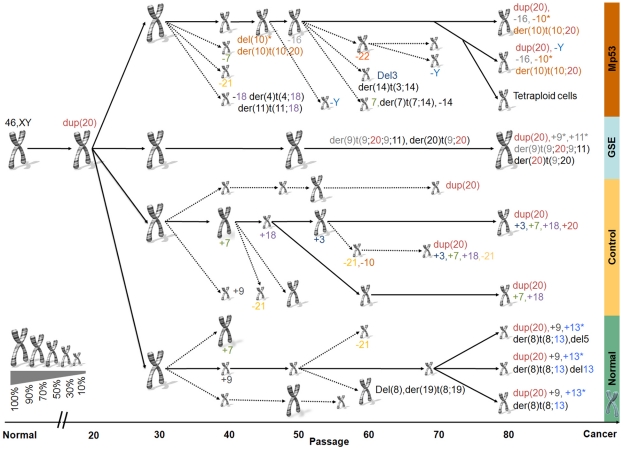
Figure 4. Karyotype evolutionary tree.
The figure was generated on the basis of the 24 SKY results along the prostate cancer transformation process and the expression karyotype. Normal prostate human cells (left side of the figure) were used to establish 4 immortalized different lines: GSE, Control, Normal, and Mutant p53 (see text) that proliferate during 80 passages (x-axis). The chromosome sign denotes a karyotype, its size represents the percent from the total cells (larger size corresponds to higher percentage) and the colored number (if exists) under the chromosomal sign corresponds to a new aberration that appears. The dashed arrows represent karyotype "species" that become extinct. Since the SKY was done only on small numbers of cells and the cells were under selective pressure, in case of a discrepancy between different SKY results along the time line our assumption is that there is continuity in the cells. That is, an aberration has low probability to disappear and then appear again, rather than being missed in a single SKY. Similarly to other evolutionary trees, the "karyotype evolutionary tree" allows us to understand better which karyotype "species" emerge, evolve or become extinct during the process. The evolutionary tree points out the trait (in our case the specific insertion, deletion or aberration) that gives a particular karyotype growth advantage over others.

