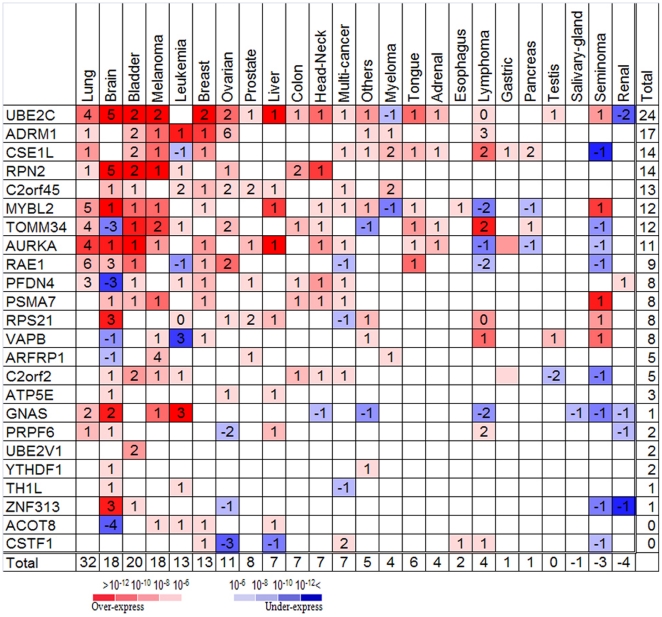
Figure 6. Summary of the expression of our 24 "purified primary target genes" in more than 360 experiments of different cancers.
The colors represent the p-value (as calculated by Oncomine) for the significantly over-expressed (red colors) or under–expressed (blue colors) genes in cancer samples compared to normals. If there are k experiments (represented by the number k in the colored boxes) the colors represent the best of the k p-values. In the few cases when the gene was over-expressed in some experiments and under-expressed in others in the same kind of cancer, the number represents the differences between the two; positive numbers mean more experiments with over-expression, negative numbers - more under-expression.

