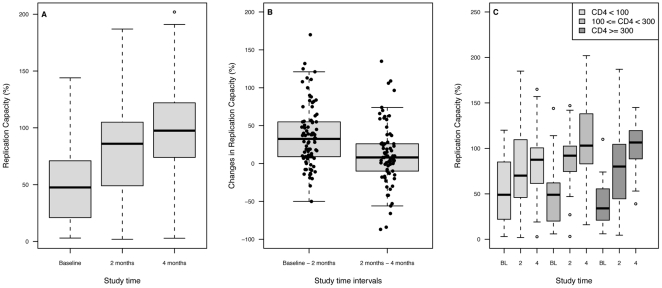
Figure 1. Change in Replication Capacity (RC) during 4 months of structured treatment interruption (STI).
Panel A: Distribution of Replication Capacity of the patient virus at baseline (BL), 2 months and 4 months of STI. The increasing trend is significant (trend test p-value <1 10-15). Panel B: Distribution of RC change by time intervals (between baseline and 2 months of STI, and between 2 months and 4 months of STI). The decrease in RC changes over time shows that most changes in RC happen between baseline and 2 months. The wide range of individual values shows inter-patient variability in the reversion to wild-type. Panel C: RC change by baseline CD4 strata. The 3 groups were defined as baseline CD4 counts <100 cells/mm3 (lowCD4BL), 100≤CD4<300 (medCD4BL), and CD4≥300 (highCD4BL). Median RC change during 4 months of STI was 18 in lowCD4BL, 63.5 in medCD4BL and 57 in highCD4BL. The differences between ΔRC in lowCD4BL and in the 2 other groups were significant (p = 0.019 and 0.004).

