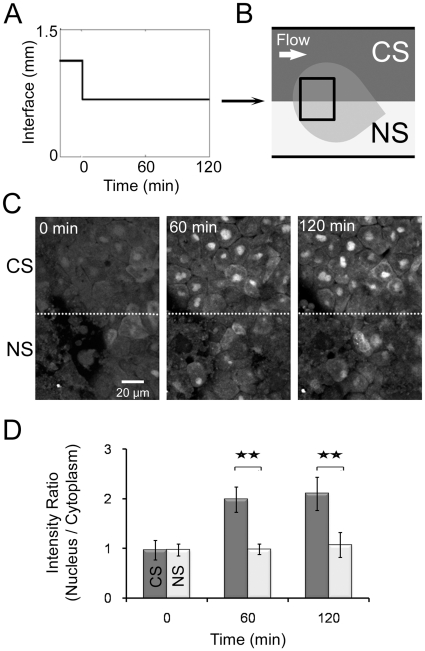
Figure 2. Localized response to spatially defined continuous stimulation.
(A) Laminar flow interface profile over time. (B) Schematic depicting two regions within a single AC explant subject to different stimulation conditions: constant stimulation (CS; upper region; DEX & DFA) and no stimulation (NS; lower region; DFA). (C) Images of the explant subjected to CS and NS depicted in (B) at the beginning (left), 60 minutes (middle), and 120 minutes (right). The dotted line marks the interface, which correlates to the line between CS and NS regions in (B). (D) Intensity ratios of GFP levels in nucleus relative to cytoplasm. Error bars represent standard deviations for 20 cells (** indicates p<0.01). Variable expression of GR-nuc-GFP biosensor across the animal cap is due to the uneven inheritance of mRNA encoding GR-nuc-GFP into 1 or 2-cell stage embryo.

