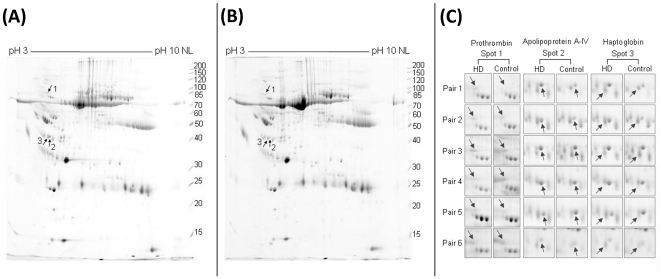
Figure 1. 2-DE maps of CSF proteomes.
Representative 2-DE maps of CSF proteome from a patient with HD (A) and a control (B) are shown. Spots 1–3 indicate proteins with up-regulation in HD. Cropped images containing spots corresponding to prothrombin (spot 1), apolipoprotein A-IV (Apo A-IV, spots 2) and haptoglobin (spot 3) (indicated by arrowheads) derived from 2-DE maps of six CSF samples of patients with HD and paired control samples (C).

