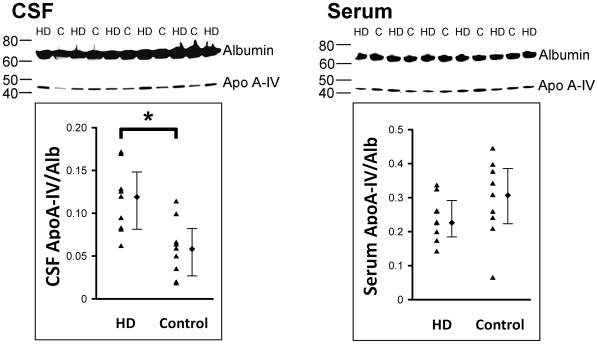
Figure 3. Representative Western blots of Apo A-IV (46 kD) and albumin (64 kD) in CSF and serum, respectively, of HD patients and their corresponding controls (C).
The Apo A-IV/Alb ratios in CSF and serum in comparison with their corresponding control groups are illustrated in scatter plots with median and interquartile rang, respectively. The Apo A-IV/Alb ratio in CSF of HD patients (n = 9) is significantly higher when compared with the controls (n = 9). *p<0.01, Mann-Whitney U test.

