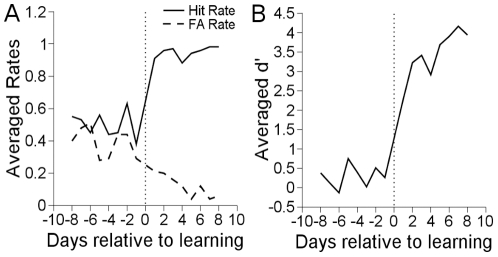
Figure 3. Behavioral performance in detection learning.
A. Hit and false alarm rates for detection learning. Different experimental runs were aligned on the day of learning which typically featured a sharp break between hit and false alarm rates. B. d' averaged across experimental runs. d' increases as hit rate increases and false alarm rate decreases. In this and all subsequent daily learning graphs, data points do not occur on day zero. Day -1 is the pre-behavioral data collection session on the day of learning before learning occurred. Day 1 is the day after learning occurred. Day 1 and day -1 are temporally separated by one day.

