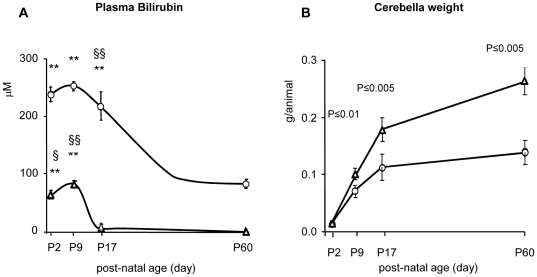
Figure 2. Plasma bilirubin and cerebellar weight in jj and Jj Gunn rats.
The values are expressed as mean ± SD of 12–20 animals for each age and genotype. Round filled dots: jj animals; empty triangles: Jj controls. Panel A: total plasma bilirubin (Tbil) amount in developing hyperbilirubinemic (jj) and control (Jj) Gunn rats. Tbil concentration differences between jj and age-matched Jj animals were all statistically significant (P≤0.005). Within each phenotype: **: p<0.005 vs. P60; § and §§ : p<0.05 and 0.005 respectively vs. next age group. Panel B shows the cerebellar growth expressed as g/animal. The level of significance is indicated by comparison with age-matched not jaundiced Jj animals.

