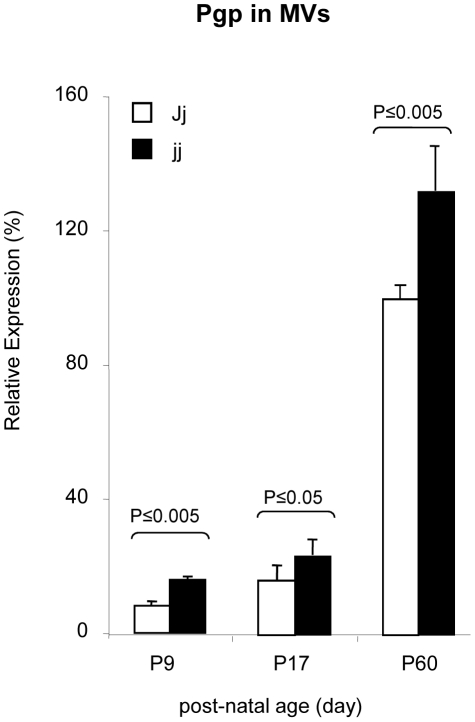
Figure 4. Pgp relative expression in isolated Jj and jj Gunn rat microvessels.
The Pgp amount in each sample is expressed as % of the Pgp amount in the Reference Sample (Pooled P60 Jj MVs preparations). White bars: heterozygous (Jj) rats, black bars: hyperbilirubinemic homozygous (jj) animals. The values are expressed as mean ± SD. Statistical significance is indicated.

