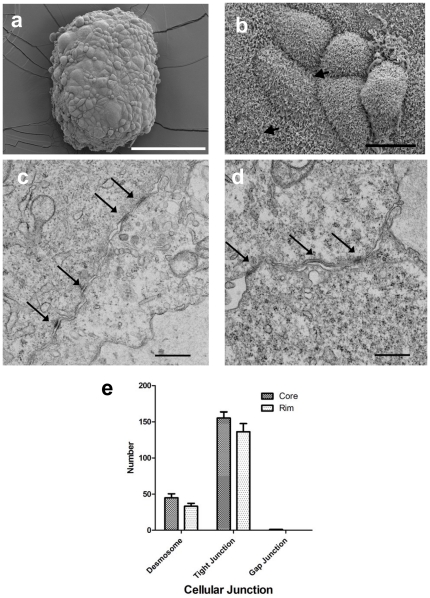
Figure 5. Electron microscopy of cell contacts in NCI-H226 mesothelioma spheroids.
A and B. SEM analysis showing microvilli (arrow). Scale bars, 200 µm (A) and 10 µm (B). C and D. Ultrathin sections (TEM). Presence of intracellular tight junctions (arrow). Scale bar, 0.5 µm. E. Number of cellular junctions in the core and rim areas.

