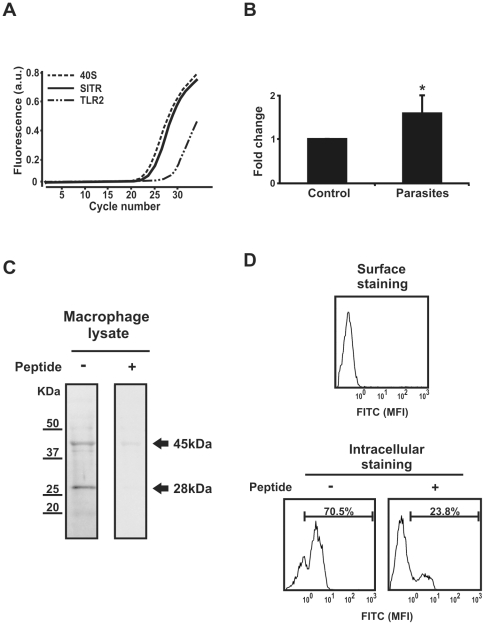
Figure 3. SITR gene and protein expression in carp macrophages.
A. Real-time qPCR cycle profile for SITR in naïve carp macrophages in comparison with the house keeping gene 40S ribosomal protein S11 and Toll-Like Receptor (TLR)2 as reference genes. B. SITR gene expression in carp macrophages after stimulation for 6 h with live T. borreli protozoan parasites (0.5×10⁶ per well). mRNA levels of SITR relative to the house keeping gene 40S ribosomal protein S11 are expressed as fold change relative to unstimulated cells (control). Bars show averages ± SD of n = 4 fish. Symbol (*) shows a significant (P≤0.05) difference compared with unstimulated cells. C. Western blot analysis of macrophage lysates using as primary antibody the anti-SITR antibody or the anti-SITR antibody pre-incubated with the immunizing peptide (20µg/ml). D. Surface and intracellular SITR protein staining detected by flow cytometry using anti-SITR antibody or anti-SITR antibody pre-incubated with the immunizing peptide (20µg/ml).

