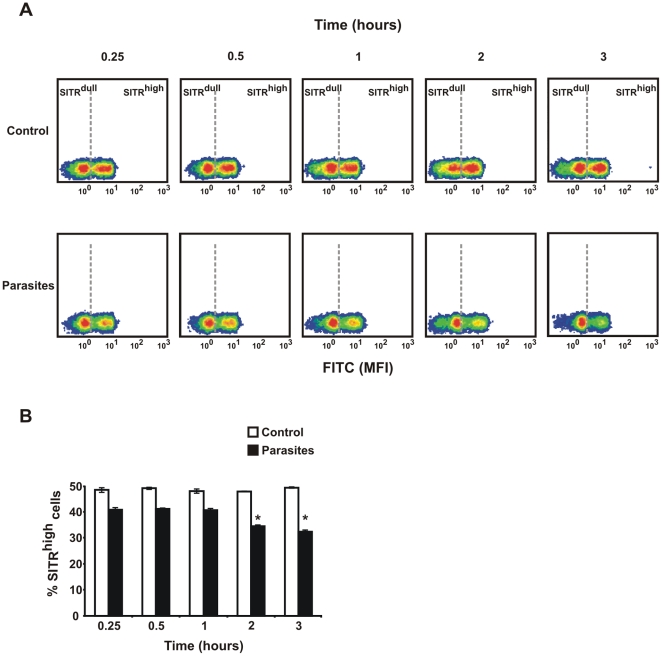
Figure 5. Effect of parasite stimulation on percentage of SITR-positive cells.
A. Density plots of intracellular SITR protein expression analysed by flow cytometry using anti-SITR antibody. Macrophages were stimulated with live T. borreli parasites (0.5×10⁶ per well) for different time periods or left untreated as negative control. Two populations of cells could be defined on the basis of SITR protein expression: SITRdull and SITRhigh for the density plot representing negative control cells at 0.25 h. The separation (grey dashed line) between SITRdull and SITRhigh gates was defined based on each negative control (at 0.25, 0.5, 1, 2 and 3 hours) and set as the line separating the two populations. The same SITRdull and SITRhigh gate settings were used to analyse the parasite-stimulated samples at the respective time points. Density plots shown are representative of one out of three experiments. Mean fluorescent intensity (MFI) of FITC and PE are represented in X and Y axes, respectively. B. Percentage SITRhigh cell populations (averages ± SD of n = 3 fish) after stimulation of macrophages with live T. borreli parasites for different time periods, or left untreated as negative control. Symbol (*) indicates a significant (P≤0.05) difference in parasite-stimulated cells compared with unstimulated cells at the same time point.

