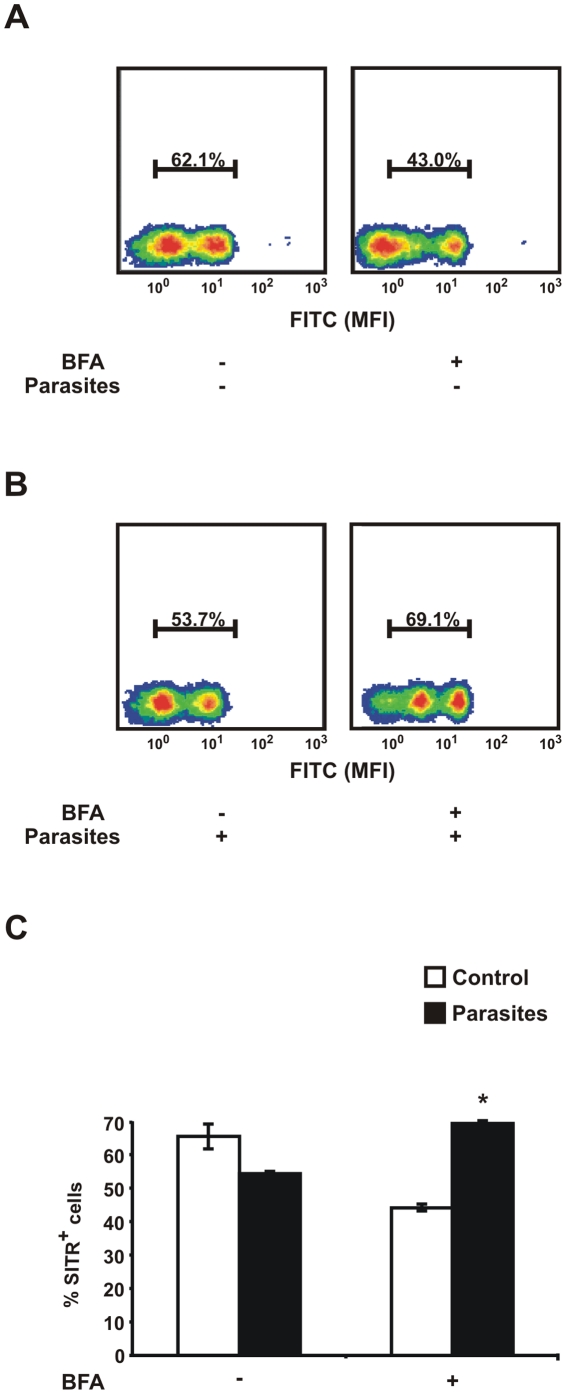
Figure 6. Intracellular SITR protein sorting.
A. Carp macrophages were incubated for 16.5 h with brefeldin A (BFA, 2 µg/ml) or left untreated as negative control. B. Macrophages were pre-incubated for 30 min with BFA (2 µg/ml) or left untreated as negative control and further stimulated for 16 h with live T. borreli parasites (0.5×10⁶ per well). Percentage (%) of cells with an MFI higher than 10° was defined as % SITR+ cells for all the density plots based on the plot obtained with the negative isotype control. The density plots of intracellular SITR protein expression analysed by flow cytometry using anti-SITR antibody are representative of four experiments. Mean fluorescent intensity (MFI) of FITC and PE are represented in X and Y axes, respectively. C. Percentage SITRhigh cell populations (averages ± SD of n = 4 fish) after pre-incubation for 30 min with BFA, or left untreated as negative control, followed by stimulation with live T. borreli parasites for 16 h. Symbol (*) indicates a significant (P≤0.05) difference in parasite stimulated cells compared with unstimulated cells.

