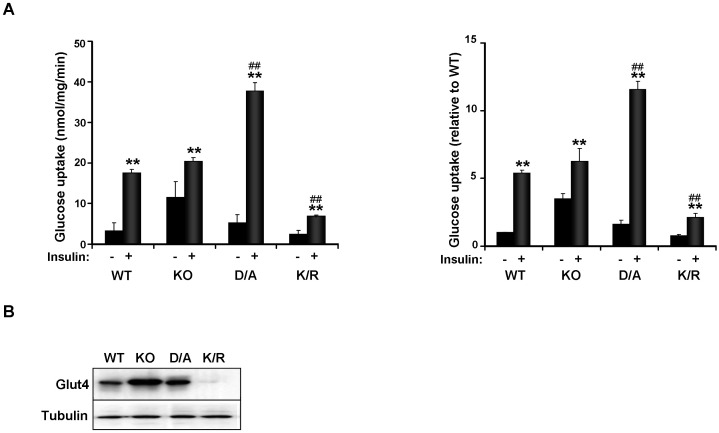
Figure 6. Insulin-induced glucose uptake is impaired in K/R adipocytes.
A) Differentiated KO and reconstituted cells were serum starved O/N then stimulated with insulin (100 nM) for 30 minutes followed by addition of 2-deoxy-[3H] glucose for 3 minutes. Data are expressed as nmol of glucose taken up/mg of cell protein/min (left panel) and as percentage of basal uptake in WT cells (right panel). Bar graphs are data from three independent experiments and data are presented as means ± SEM. B) Immunoblots of Glut4 expression in differentiated cells. Blots were probed with anti-Tubulin antibodies as a control for loading. (*) indicates statistically significant difference between basal and insulin-stimulated conditions in each cell type, while (#) indicates statistically significant difference between insulin-stimulated glucose uptake in KO, D/A and K/R cells compared with WT.

