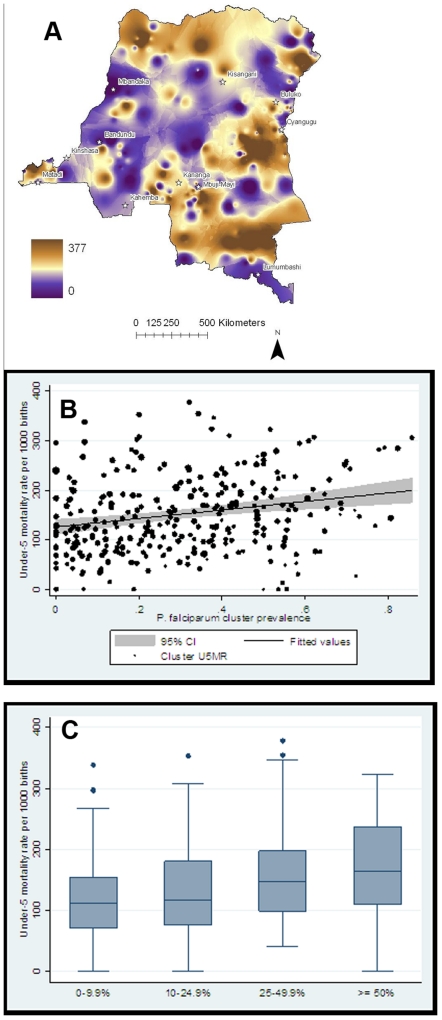
Figure 4. Under-5 mortality and malaria endemicity.
A. U5MR (deaths per 1000 live births) by survey cluster. B. Cluster U5MR by adult P. falciparum prevalence. Black dots represent actual U5MRs, weighted relative to the number of births in each cluster; black line represents trend line from an unadjusted linear regression model (R2 = 0.0538; p<0.001) weighted for differences in numbers of births between clusters (gray area is 95% confidence interval). C. Cluster U5MR by malaria endemicity category. Boxes represent interquartile range, midline is median, individual dots are outliers. p = 0.001 for overall comparison of medians by Kruskal-Wallis analysis of variance.

