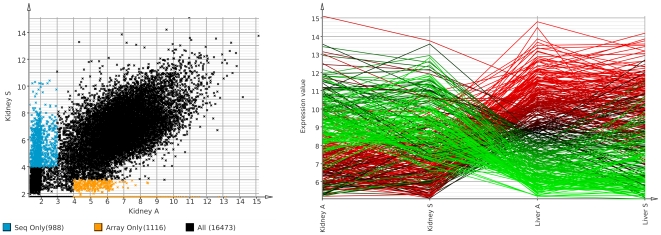
Figure 3. Case study.
Total RNA from liver and kidney of a single human male was extracted, sequenced as well as hybridized microarrays. We used three sequencing replicates and three microarray replicates for each tissue. All data processing was done using Mayday SeaSight. Left: Scatter plot of mean replicate gene expression in the kidney sample for array ( axis) and sequencing data (
 axis) with the genes only found as expressed by one technology highlighted. Right: Visualization of genes reported as differentially expressed between kidney and liver by both sequencing and array data (Rank Product,
  ). Overall, both technologies show a high agreement. Some genes are only detected by one technology indicating that they complement each other.

