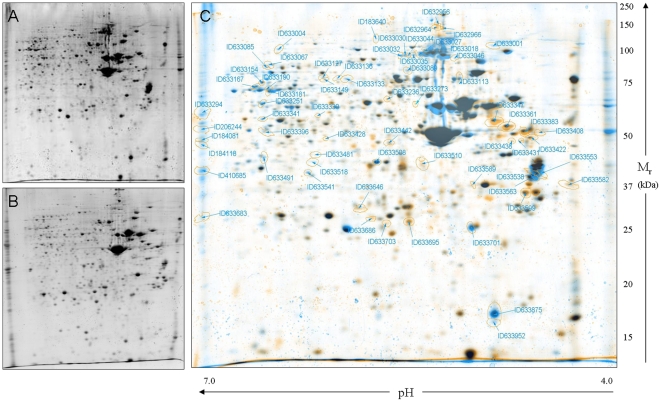
Figure 1. 2-DE representative proteomic maps (pH 4.0–7.0) of muscle cultures.
A. MS-35 control deltoid muscle; B. MS-312 HIBM deltoid muscle; C. Representative virtual overlay map of controls and HIBM gels; protein expression of control (blue), HIBM (orange) and overlapped expression (black). Only unique (blue or orange) spots were analyzed further.

