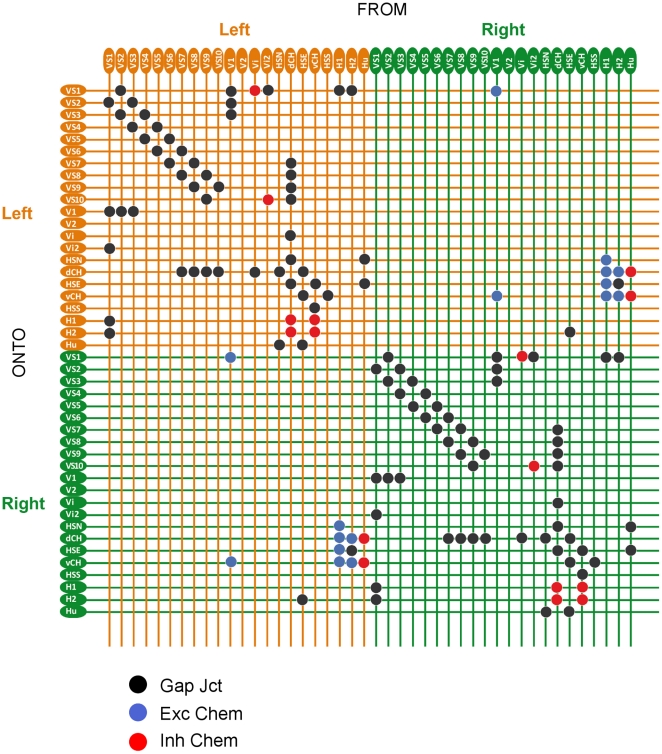
Figure 12. Connectivity matrix of the lobula plate network.
The matrix visualizes how the tangential cells within one lobula plate and between the left and right lobula plate are connected. All cells are listed along the rows and columns. A coupling between the cell in row i and the cell in column j is indicated by a dot at the intersection of row i and column j. The coloring of the dots depicts the type of connectivity (black – gap junction, blue – excitatory chemical synapse, red – inhibitory chemical synapse; see legend).

