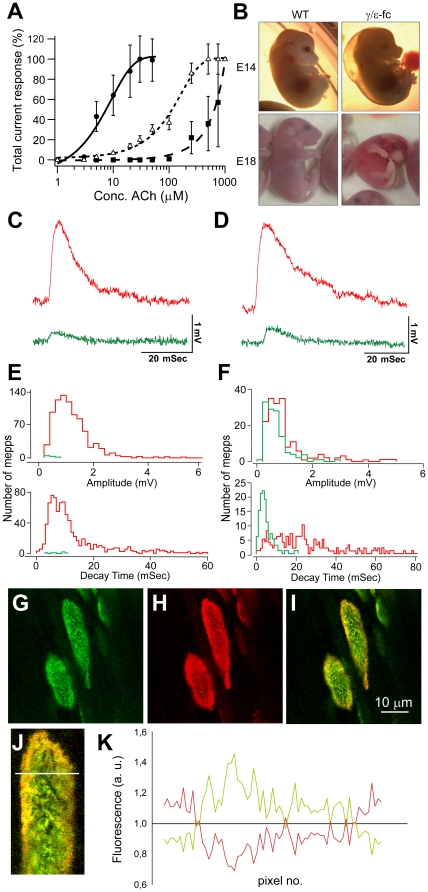
Figure 2. Electrophysiological and molecular characterization of the γ/ε-fc mice.
(A) Whole cell current responses of Xenopus laevis oocytes expressing recombinant AChRε (•) or mutant AChR containing γP121L (Δ) and εP121L (▪) subunits at different concentrations of ACh (experimental details see Peter et al., 2005). Data are represented as mean (n = 9–11) ± SEM. (B) γ/ε-fc embryos and their wild type (WT) littermates at embryonic day 14 (E14) and 18 (E18). (C) Sample miniature endplate potentials (mepps) recorded in diaphragm muscles of E16 and (D) E18 embryos having the WT (red) and γ/ε-fc (green) genotype. (E) Distributions of amplitude and 90% to 10% decay times for mepps recorded from E16 and (F) E18 embryos. Red bars indicate WT and green bars indicate γ/ε-fc. The numbers of mepps, endplates, and muscles providing the data for each histogram were as follows. E16 embryos: 831, 29, 3 (WT) and 6, 72, 5 (γ/ε-fc); E18 embryos 170, 45, 3 (WT) and 123, 42, 6 (γ/ε-fc). (G–I) Confocal images of γ/ε-fc endplates in an E19 diaphragm: (G) GFP fluorescence present only in receptors containing the AChRγ/ε-fc subunit, (H) R-bgt staining of the full AChR load of AChRγ/ε-fc and AChRε, (I) Overlay showing accumulation of adult AChRε on the edges of the endplate. Scale bar: 10 µm. (J) Detail of the above endplate; the white line indicates a sample measurement area (see Material and Methods). (K) Fluorescence intensity measurement illustrates differential distribution of GFP-tagged AChRγ/ε-fc and adult AChRε. The green line represents green to red fluorescent intensity ratios averaged along 5 transversal sections as indicated in (J) being smallest at the edges of the endplate. The red line represents the ratio of red to green fluorescence which is highest at the edges where AChRε are inserted.

