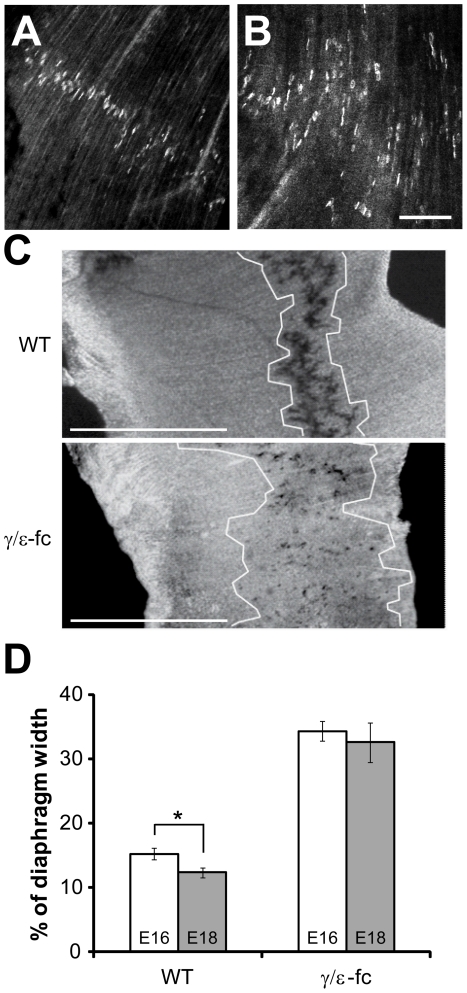
Figure 4. Endplate distribution.
(A) Confocal images of endplate distribution in WT diaphragm of E18 embryos, visualized with Alexa-488-labeled α-bungarotoxin and (B) γ/ε-fc homozygous embryos. Scale bar: 100 µm. (C) E18 diaphragms from wild type (WT) and γ/ε-fc homozygous embryos stained histochemically for AChE enzyme activity. The width of the endplate band was measured as detailed in Material and Methods and is marked schematically by white boundaries. Scale bar: 1 mm. (B) Comparison of total endplate distribution widths (as percentages of total diaphragm width) between embryos within the same group (WT, white; or γ/ε-fc, gray) at ages E16 and E18. n = 27 measurements, 2 embryos per point. All data are represented as mean ± SEM.

