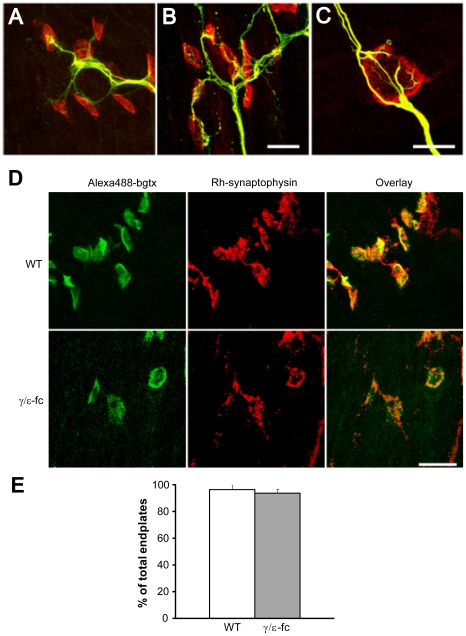
Figure 5. Innervation of individual endplates.
(A) Neurofilament (green) and r-bgt (red) staining of nerve terminals and postsynaptic endplates in WT and (B) γ/ε-fc diaphragms of E18 embryos (scale bar: 20 µm). (C) Close-up of a single γ/ε-fc endplate, showing additional nerve sprouting after endplate innervation (scale bar: 10 µm). (D) Synaptophysin (Rh-synaptophysin, red) and Alexa-488-labeled α-bungarotoxin (green) staining of nerve terminals and postsynaptic endplates inWT and γ/ε-fc E18 embryos, showing co-localization of nerve terminals and endplates. Scale bar: 20 µm. (E) Percentage of synaptophysin-rich innervated endplates in WT (white) and γ/ε-fc (gray) embryos. n = 100 endplates, 2 embryos per point. All data are represented as mean ± SEM.

