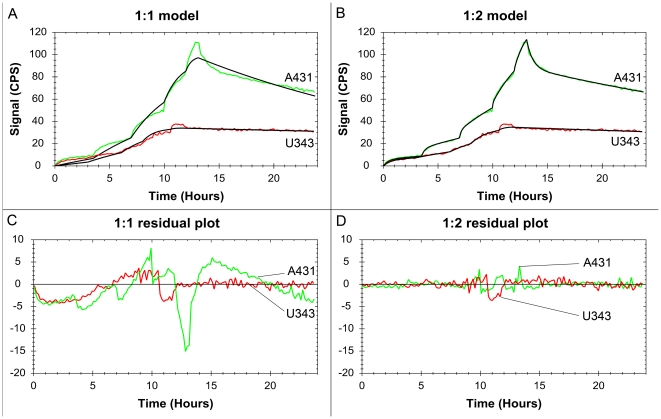
Figure 2. Fitting binding curves to 1∶1 and 1∶2 interaction models.
(A) 1∶1 and (B) 1∶2 interaction models (black) fitted to titration data of 125I-EGF binding to A431(green) and U343 (red) cultured cells. The deviations of the fitted models from the data are described in residual plots for the (C) 1∶1 and (D) 1∶2 interaction models. The 1∶1 interaction model fits the data poorly.

