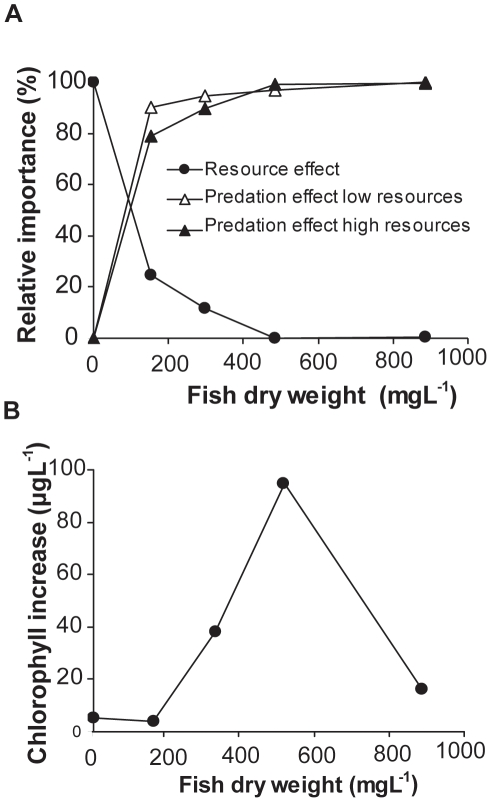
Figure 3. Effects of resource situation and fish predation on cladocerans and chlorophyll-α abundance at different fish densities.
A: Effects of resources and predation on cladocerans as a function of fish biomass. Resource effects are expressed as difference in mean cladoceran densities between high and low resource treatments over all dates along a fish biomass gradient (mean of high and low resource treatments). 100% denotes the maximum difference in fish free enclosures. The predation effect is expressed as the proportion of cladocerans removed by fish predation compared to the cladoceran population in fish free enclosures in high and low resource enclosures. B: Effects of resources on chlorophyll-a as a function of fish biomass. Resource effects are expressed as difference in chlorophyll-concentrations between high and low resource treatments over all dates along a fish biomass gradient (mean of high and low resource treatments).

