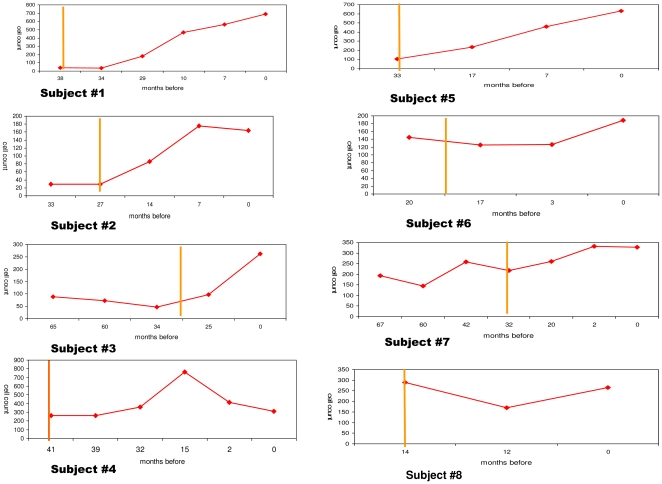
Figure 1. Changes in CD4 cell counts during HAART treatment of 5 group A and 3 group B HIV/HCV coinfected patients.
Curves represent the absolute number of CD4 cells/µl of peripheral blood (y axis) over time (x axis-months before the most recent sample) for each HAART treated patient. Subjects#1-5: immunological responders (group A); subjects#6-8 non responders (group B). The vertical yellow line indicates time of HAART initiation.

